How to read weather radar
What the colors mean, why velocity matters more than reflectivity, and what the radar physically cannot see.
A radar image is not a photograph of rain. It is a map of how much energy came back to an antenna, and understanding that difference is most of what separates someone who looks at radar from someone who reads it.
What the radar actually does
A WSR-88D transmits a pulse and listens. Three things come back, and each answers a different question.
- Power — how much energy returned, reported as reflectivity in dBZ. Larger or more numerous targets return more.
- Phase shift — whether the target moved toward or away from the radar between pulses. This is velocity, and it is the half of the data most people never look at.
- Polarization difference — how the return differs between horizontally and vertically transmitted pulses. This is what dual-polarization added, and it is how radar distinguishes hail from rain, and debris from either.
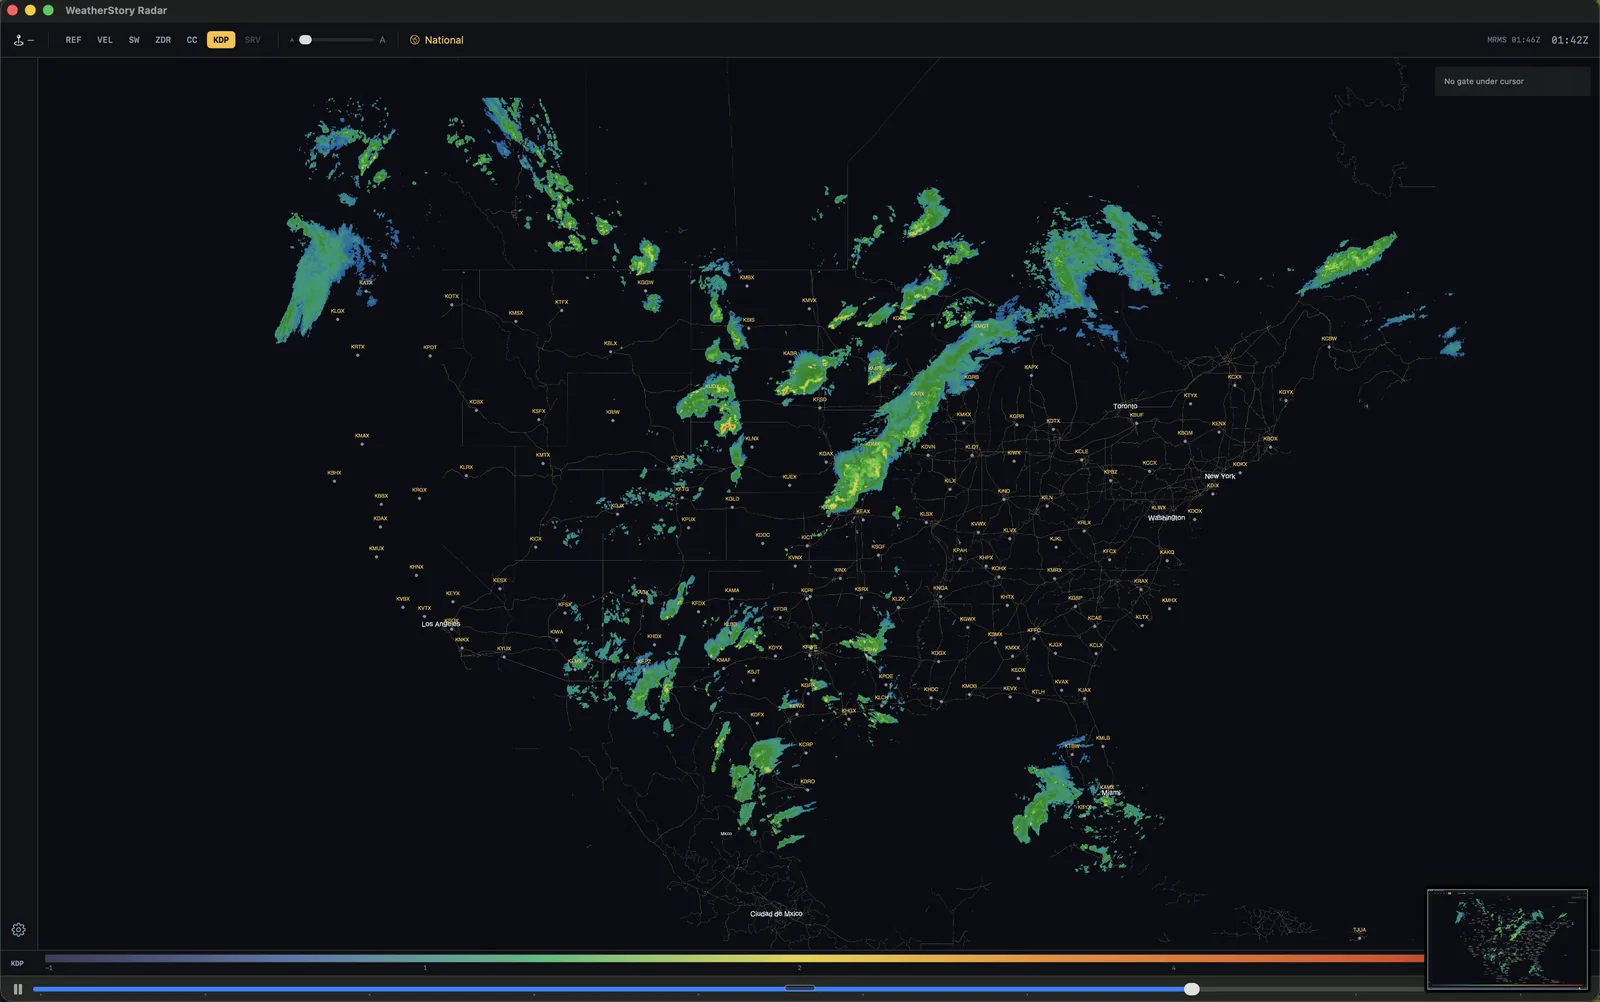
Reflectivity: what the colors mean
dBZ is logarithmic. Each 10 dBZ step is roughly a tenfold increase in returned power, so the gap between 45 and 55 dBZ is far larger than the color ramp makes it look.
| dBZ | Typically |
|---|---|
| 5–20 | Drizzle, light snow, or clear-air returns — insects, dust, birds |
| 20–35 | Light to moderate rain |
| 35–45 | Heavy rain; convective cores begin here |
| 45–55 | Very heavy rain, small hail becomes plausible |
| 55–65 | Hail likely |
| 65+ | Large hail almost certain — rain alone rarely reaches this |
Two cautions matter more than the table. The color scale is a choice, not a measurement. Two apps showing the same volume with different palettes look like different storms. The number is the datum; the color is an interpretation laid on top. That is why a serious tool lets you read the exact value at a gate rather than asking you to judge a hue.
And “composite” and “base” are different products. Base reflectivity is one elevation sweep — a single cone through the storm. Composite takes the maximum over all elevations, so a strong core aloft appears on the map even when nothing has reached the ground. A composite showing 60 dBZ over your house does not mean 60 dBZ is at your house.
Velocity: the half that gets ignored
Reflectivity tells you where precipitation is. Velocity tells you what the air is doing — and rotation is invisible in reflectivity alone.
Velocity is radial. It measures only motion along the beam, toward or away from the radar. A storm moving perpendicular to the beam registers as zero. That is not a defect, it is what “Doppler” means, and forgetting it produces most beginner misreads.
One color family approaches, the other recedes. What matters is not the individual colors but tight couplets — strong inbound directly beside strong outbound over a short distance. That is rotation.
Aliasing is the artifact to learn early. Each radar has a maximum unambiguous velocity; past it, readings wrap and a very fast inbound is reported as a fast outbound. It looks like violent rotation and is not. The tell is a sharp, noisy boundary with no supporting structure in reflectivity.
Dual-polarization, briefly
- ZDR — how much wider than tall the targets are. Large raindrops flatten as they fall and give high positive ZDR; hail tumbles and gives ZDR near zero despite very high reflectivity.
- Correlation coefficient (CC) — how uniform the targets are within the sample volume. Uniform rain sits near 0.98–1.00. Values below about 0.80 mean a mixture of very different things in the same volume — which is exactly what lofted debris is.
- KDP — phase shift accumulated along the beam, a rain rate estimator unaffected by partial beam blockage or by hail.
You do not classify hydrometeors by eye from a table. But knowing that a 60 dBZ core with ZDR near zero is probably hail, while the same core with high ZDR is probably a great deal of very large rain, is a real diagnostic you can make in seconds.
Volume scans, tilts and time
A radar does not take a picture. It sweeps a full circle at one elevation, steps up, sweeps again, and repeats through a pattern. A complete volume takes roughly four to six minutes.
Two things follow. A radar image is minutes old before you see it, and the top of the storm was sampled at a different moment than the bottom. In fast-evolving convection that difference is real.
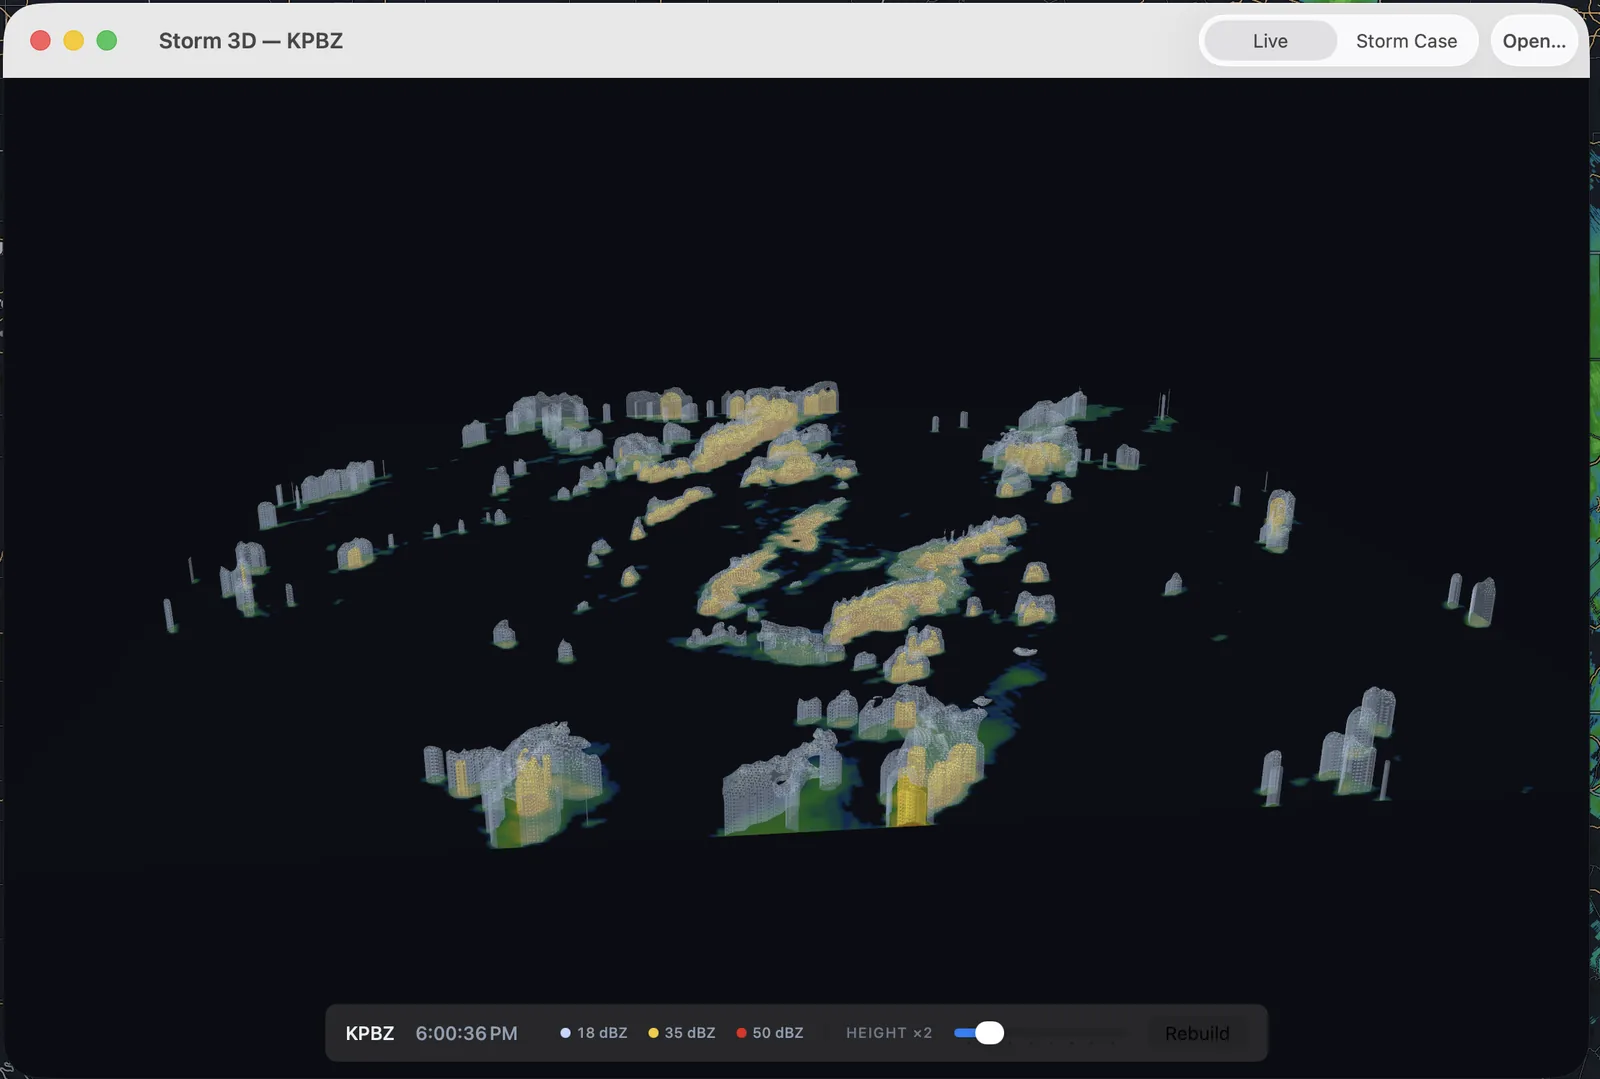
Walking the elevation stack is how you see structure in the vertical — whether a core is aloft or at the surface, whether rotation extends through the storm or exists at one level only. A tool that shows only the base sweep is showing one slice of a three-dimensional object.
Next: tornado signatures put all three fields to work at once.