WeatherStory Radar · macOS
A radar workbench that runs on your Mac.
Volumetric 3D storm structure, every gate of raw Level II, GOES satellite and HRRR forecast — read straight from NOAA’s public archive and rendered on your own machine. The depth of a Windows analysis tool, built native for the Mac.
Version 0.9.0-alpha · free for 14 days, every feature · macOS 15.0+ · Apple Silicon & Intel · 179.6 MB
14 days, every feature, no card. Nothing is gated.
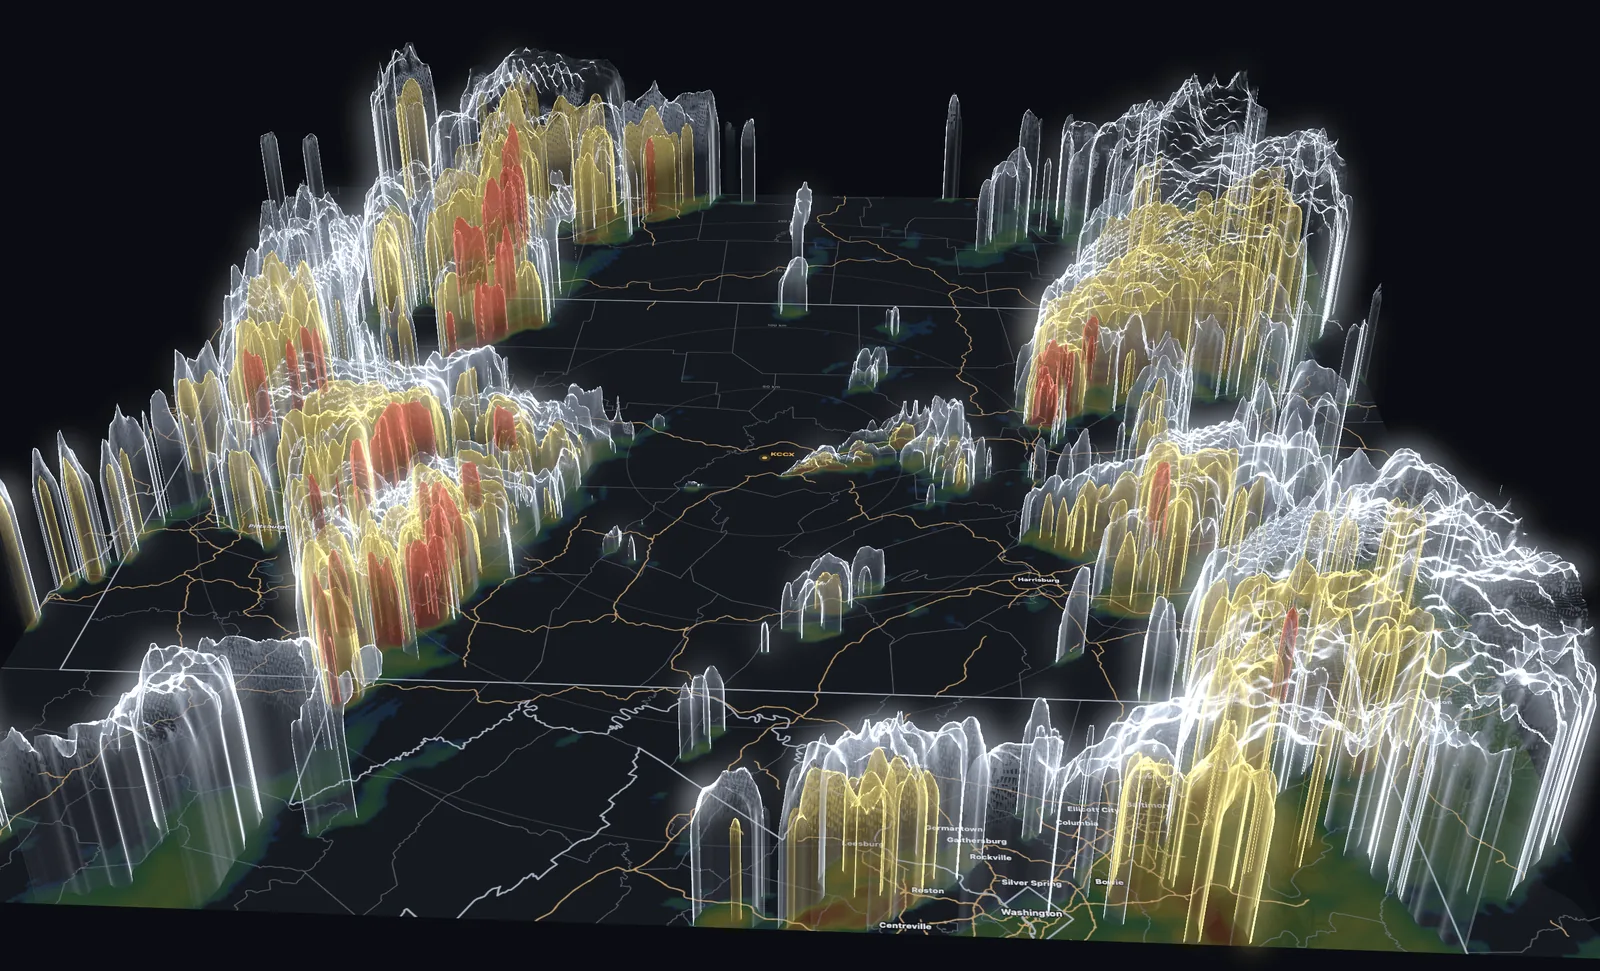
What it does
Every gate, every moment
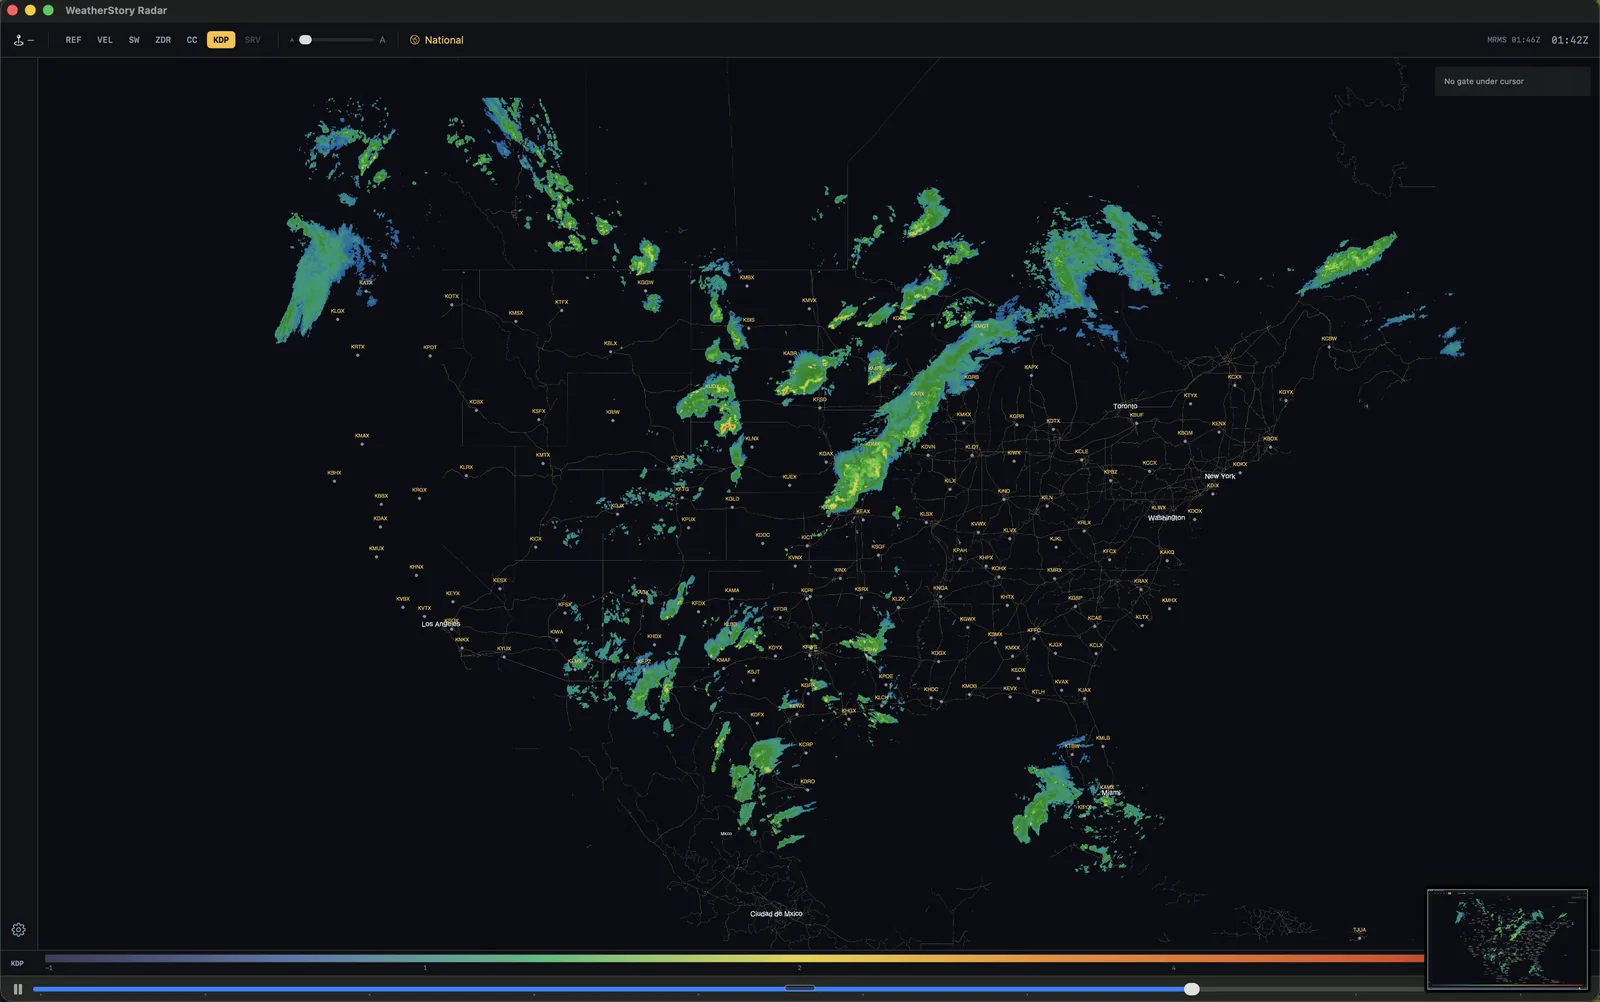
Reflectivity, velocity, spectrum width, ZDR, correlation coefficient, KDP and storm-relative velocity, decoded from raw Archive II. Click any gate for its exact value, with beam height computed through a 4/3-earth model.
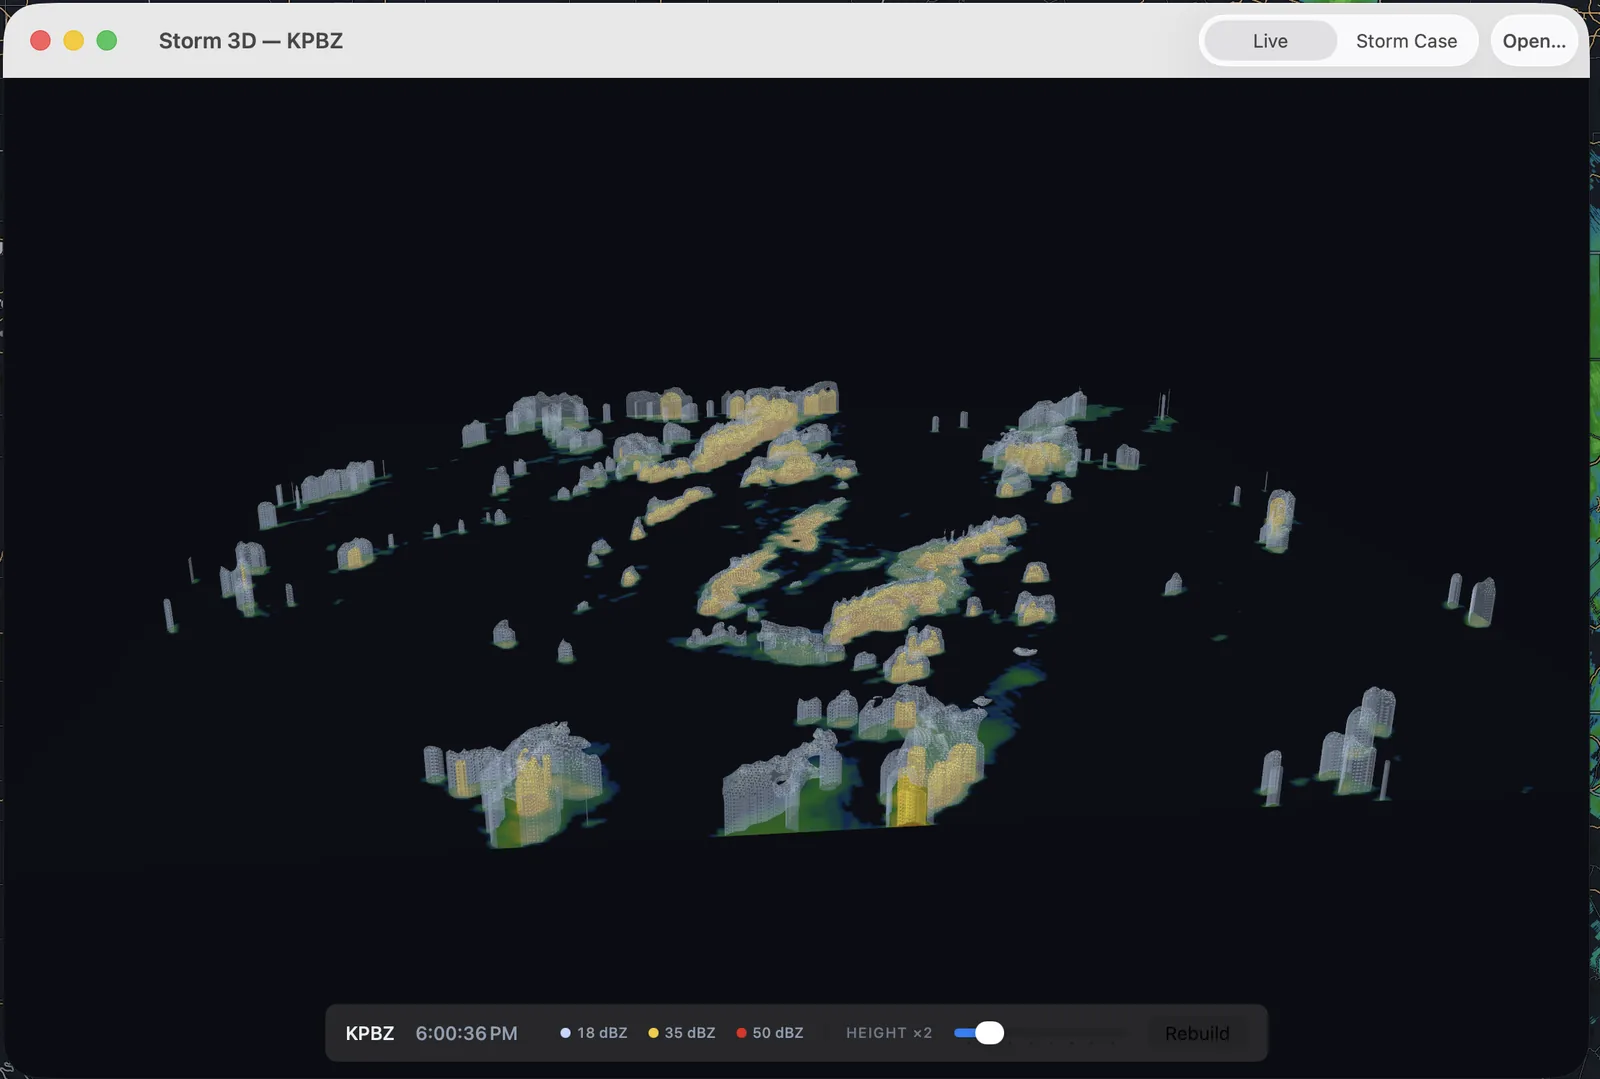
The 3D window
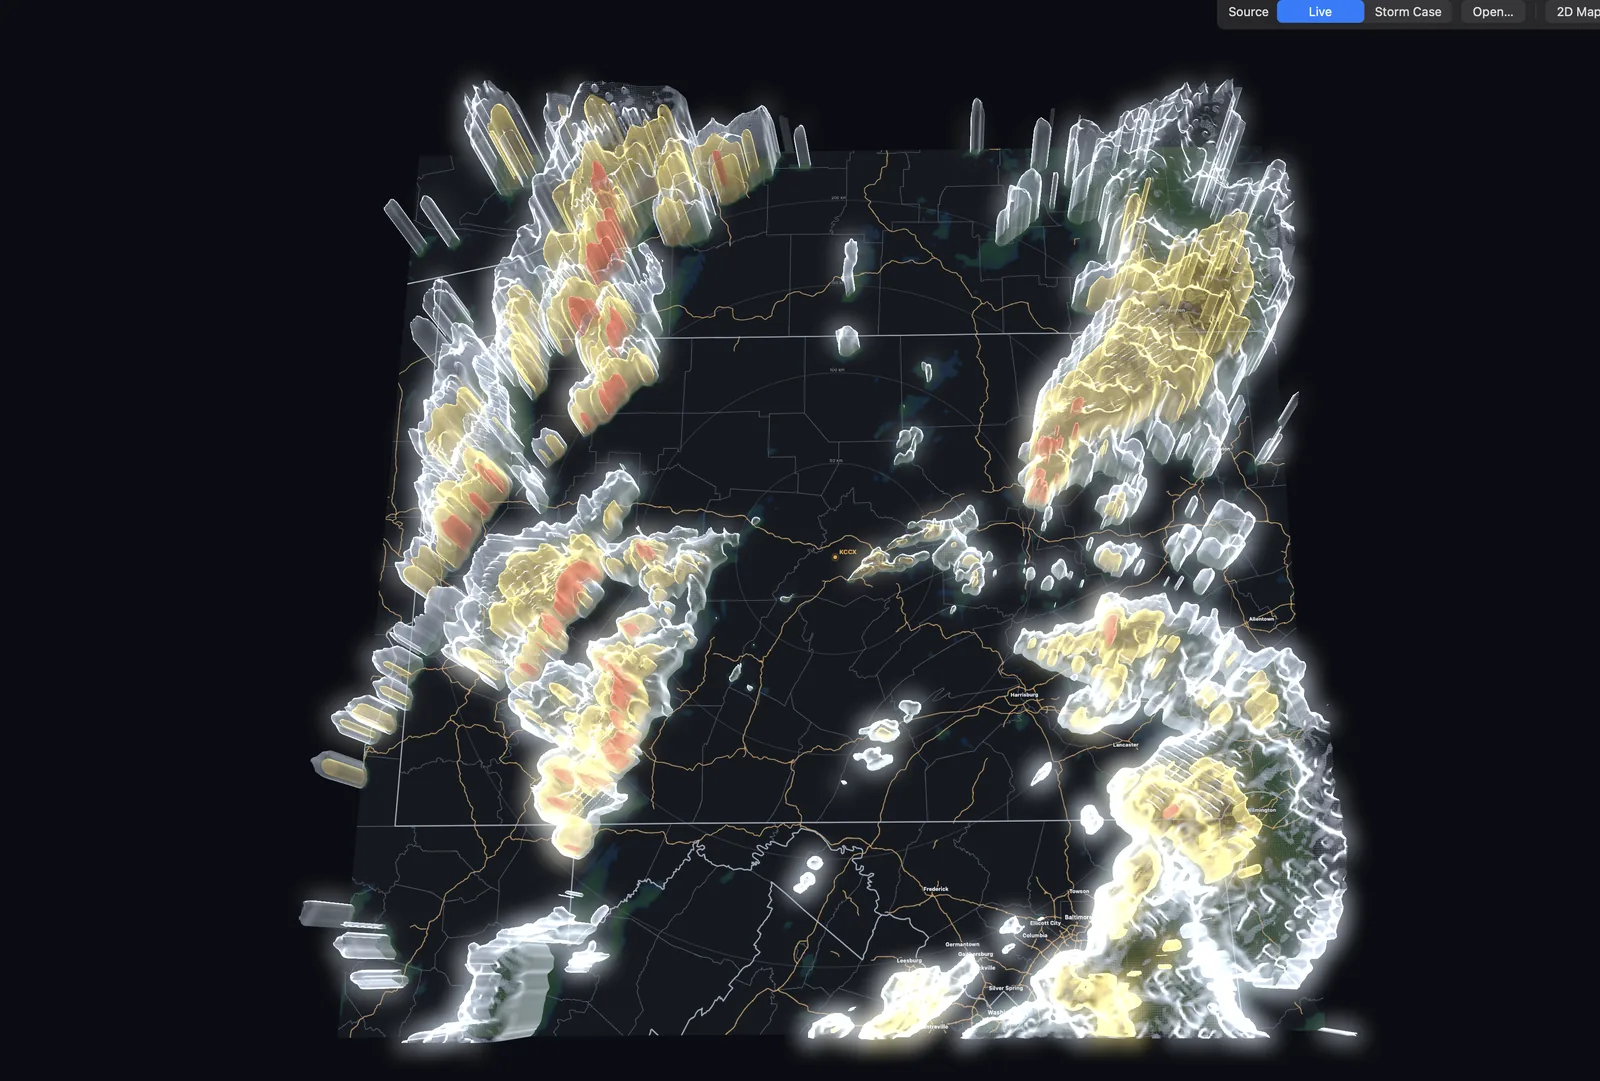
Every surface is a stated threshold rather than a look, and the window carries its own legend and height control. Vertical exaggeration is shown on screen, computed from the grid you are actually looking at.
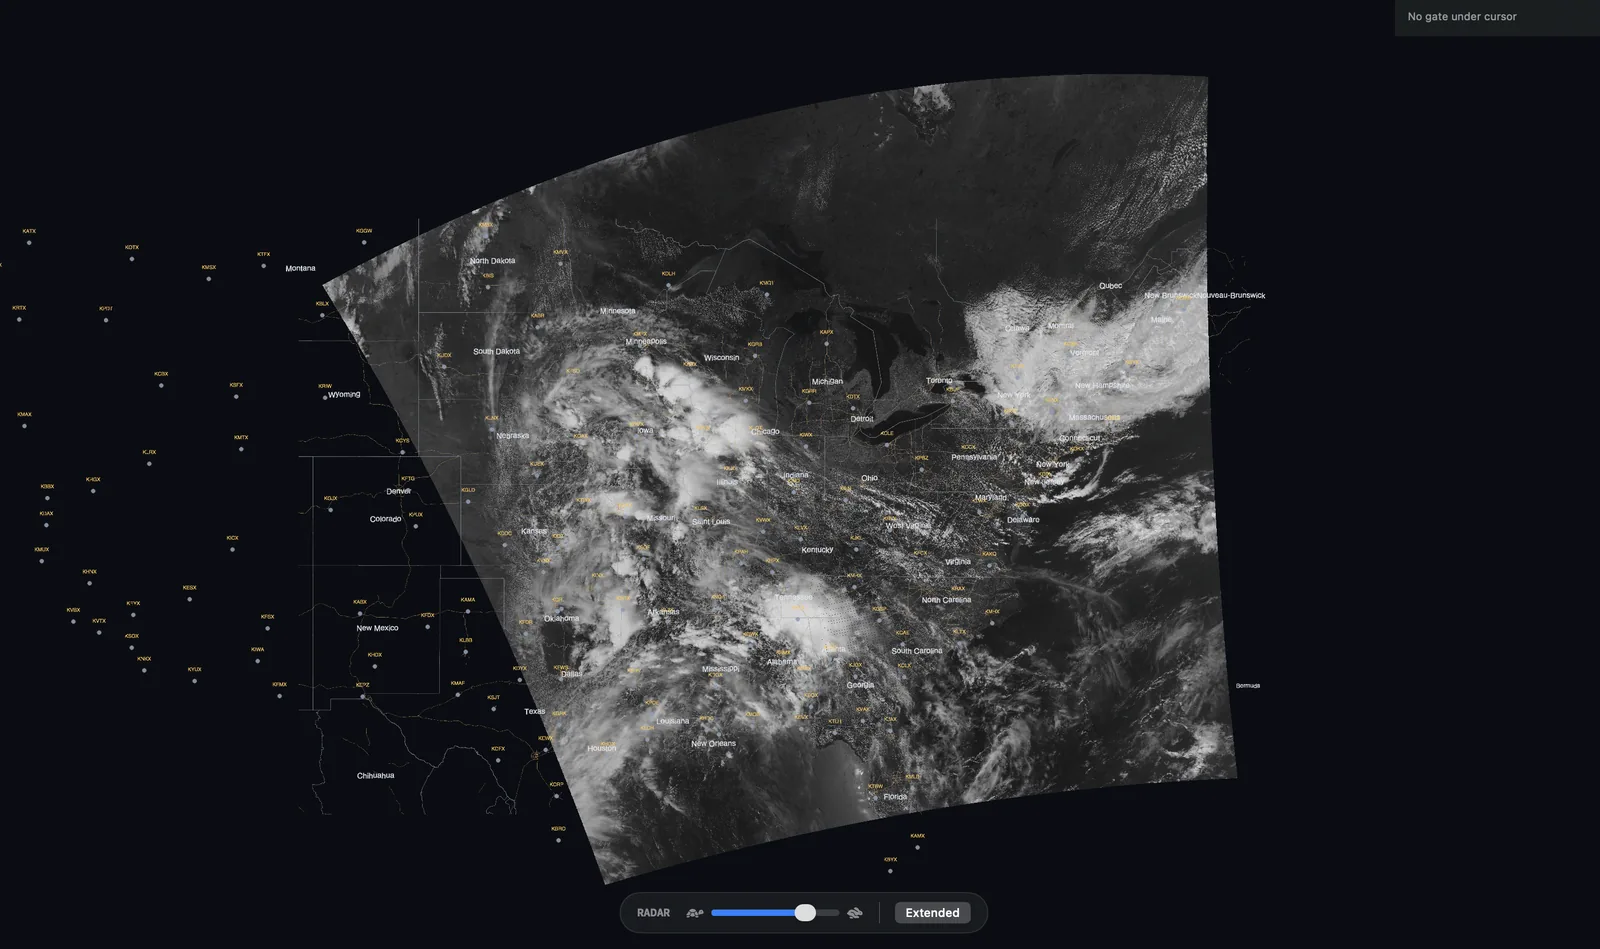
Satellite, at its own resolution
GOES true color pan-sharpened to 500 m, clean IR with the published NOAA enhancement curve, and VIIRS passes at 375 m drawn on their true footprint — honest about where the granule ends rather than stretched to fill the map.
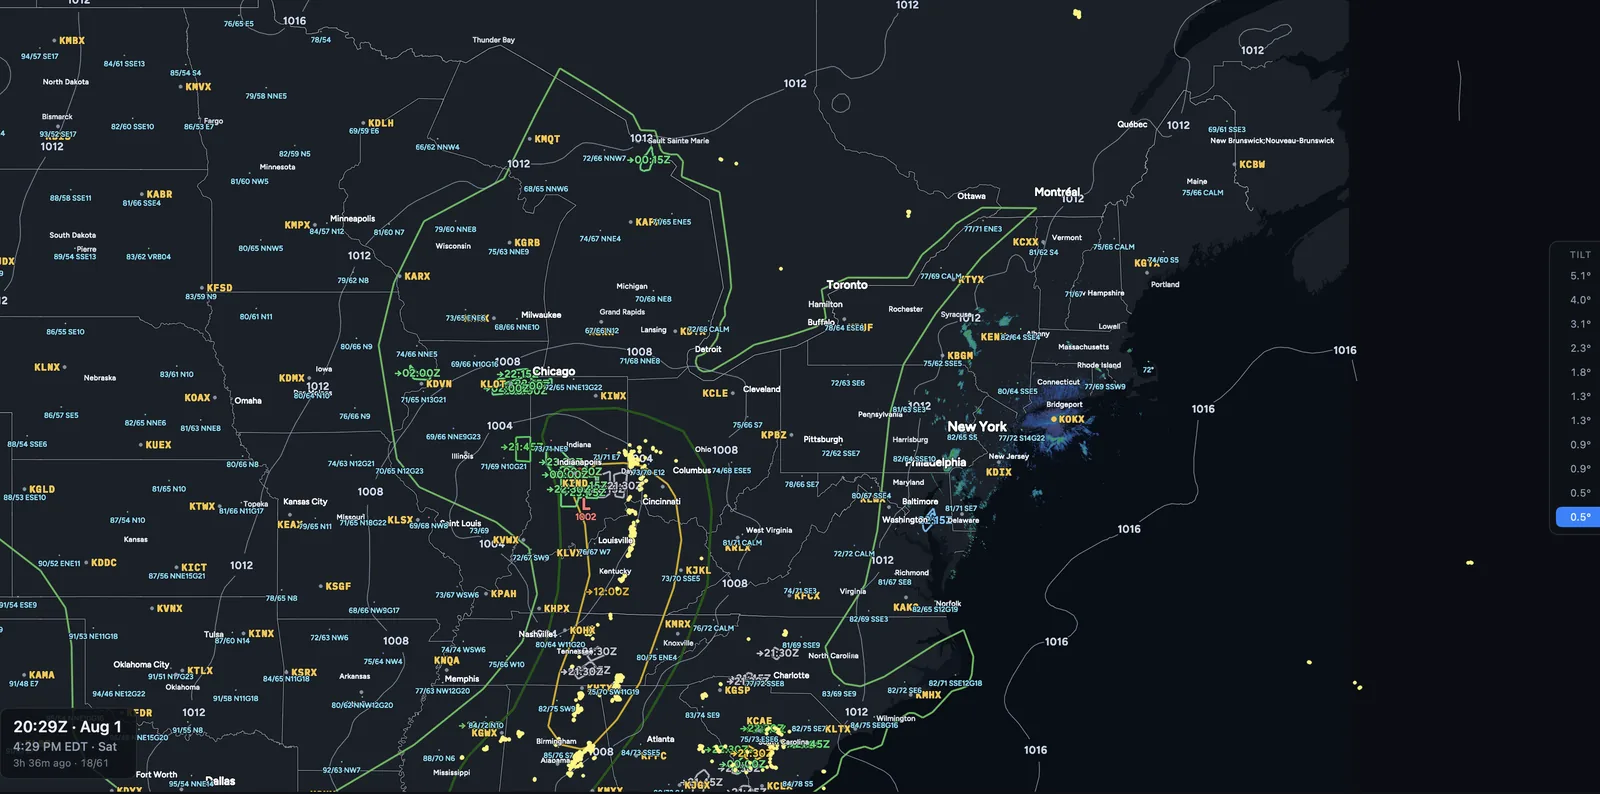
The whole country, undiminished
Every cell of the 7000×3500 composite grid, at about one kilometre. Nothing is thinned to make it draw faster, and the color table is the only thing between you and the number.
Storm motion
Cross-correlated between consecutive scans. Arrow length is never normalised, so a longer arrow is a faster storm.
Past the present
HRRR forecast reflectivity extends the loop hourly to +12 hours, with a bright seam marking now.
Long loops
About thirteen hours of the national mosaic on a 32 GB Mac, up to twenty-four on 64 GB.
No subscription
Level II, MRMS, GOES and HRRR read straight from public NOAA and NASA archives. No feed to buy, now or later.
What it costs
$99.00 once, including a year of updates. The app keeps working after that year — renewal only buys newer versions, never access to what you already have.
| Tool | Year one | Three years | Model |
|---|---|---|---|
| RadarScope + Pro Tier Two | $109.98 | $309.96 | Subscription |
| WeatherStory Radar | $99.00 | $99.00 | Buy once |
The trial runs 14 days with every feature enabled and no card. Worth knowing before you start it: a radar trial only proves anything if weather happens while it runs, so begin it when you expect some.
Where the data comes from
Every source is a public archive, read directly by the app. No account, no key, no server of ours in between.
| Source | What it provides | Updates |
|---|---|---|
| NEXRAD Level II | All 159 WSR-88D radars, raw Archive II | Every 4–6 min |
| MRMS | National composite, 7000×3500 at ~1 km | Every ~2 min |
| GOES-19 ABI | True color at 500 m, clean IR, cloud-top height | 5 min / 1 min meso |
| VIIRS | 375 m detail passes | A few daily |
| HRRR | Forecast reflectivity, pressure, temperature, wind | Hourly |
| METAR · NWS · SPC | Surface observations, warnings, outlooks | 5 min / as issued |
The app is signed with an Apple Developer ID and notarized, and updates are delivered over a cryptographically signed feed. Each release publishes its SHA-256 so you can verify the download.
Download it
Free for 14 days with every feature enabled. macOS 15.0 or later, Apple Silicon or Intel.
Download 0.9.0-alpha179.6 MB · published 2026-09-12 · notarized by Apple
SHA-256fd0ab7360be8472230bc12a1bb120b81a460de5179db64ebc65586616c0053c9
Still want release news? Join the list for major versions only.
Honest limits
- United States coverage: all 159 operational WSR-88D radars. TDWR and research radars are not included.
- macOS 15 or later, Apple Silicon or Intel. No Windows or Linux build is planned.
- Memory-hungry by design. Long loops hold every frame resident; the app sizes the loop to your RAM rather than pretending it is free.
- The iPhone companion is not ready and is not part of this purchase.
- Large download — the basemap ships inside the app. Map detail is built for weather-scale work and does not sharpen to street level.
- An analysis instrument, not a warning system. It has no alerting, no notifications, and should never be your only source during severe weather.
Learn to read the data: the radar guides cover reflectivity and velocity, tornado signatures, supercell structure, linear convection and forecast models — illustrated with the same full-resolution Level II shown above.
Related: the WeatherStory e-ink instrument, and the daily weather pages.